Understanding volatility is crucial for the successful trader. After all, markets don’t always behave the same, and therefore you need to be aware of what conditions you are dealing with. Some days, a currency pair might move 50 pips, on others it could move 100. Obviously, you need to treat those market conditions quite differently.
While there are a lot of ways to measure volatility, one of the most common will be using the ATR, or Average True Range indicator. By using this indicator, you can get an average amount of movement per candle, typically over the course of the last 14. (This can be changed by the trader and can be used on multiple time frames.) For the purpose of this article, I am using all typical settings, because the point of this writing isn’t so much to give you a solution, but to get you thinking about what the market is trying to tell you at any given moment.
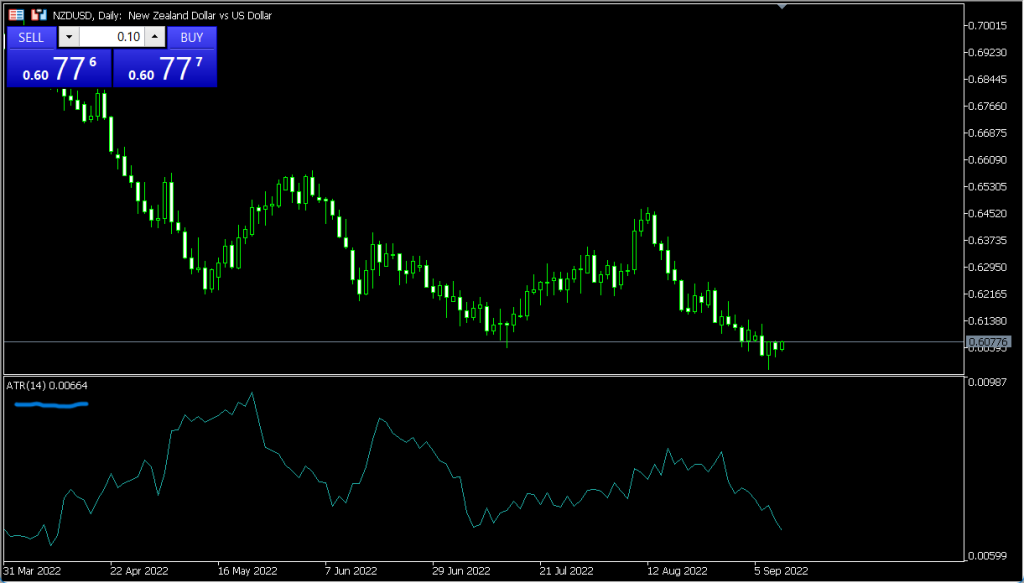
Looking at the chart below, the NZD/USD pair has been drifting lower for some time. Looking at the ATR indicator in the bottom window, it has a reading of 0.00664, as highlighted. This means that the average move range of movement per day is 66 pips. This doesn’t measure up or down, just the range of the day, over the last 14 days. Knowing this, you can use this to set stop losses, position size accordingly, and much more.

By knowing that you will, on average, see this pair move 66 pips each day, you can then begin to think about how much risk you are willing to put on, and how much to risk per pip. Let’s say that you have a $10,000 account and want to risk 1%. Some people will risk more, some less, but that’s beside the point. By knowing the ATR, you can position size based on probability.
Some traders will use 1.5 ATR as a stop loss. In this case, that would be 132 pips. If you are looking to risk 1% of a $10,000 account, then you are willing to risk $100. Your pip size would then be 0.75 pips, which is just under $100. (The real calculation would be 0.757575.) This calculation means that if the market moves one and a half times its normal movement, you are willing to bail out on the position, as it would be an obvious failure of the set up. This shows that the analysis is wrong, and it is also a mechanical way to determine position sizing and stop losses.
ATR can tell you how a market “feels.”
The ATR can also give you a bit of a “heads up” as to how the market feels at the moment. The ATR indicator has a line that measures this, and if it has been rising rapidly, you can assume that volatility is picking up, and this means the market could be a bit more dangerous. In the example of the NZD/USD chart, you can see it has been slowing. This tells you that the market has been calming down.
In some situations, the volatility profile is extreme, and therefore you may choose to risk less. The trader that was risking 1% in the relatively calm NZD/USD trade, might choose to risk only 1/2% if the reading were something like say, 113. While many new traders look at this as not offering as much in profits, the reality is that the market is moving much quicker, and therefore you should be able to make the same amount – or lose it. Remember the idea of trading is about making consistent gains. It’s not that you cannot get aggressive when the time is right, but that is rare, and normally after you have already been in profit, perhaps riding a longer-term trend.
Each trader will have to come up with how they measure the environment that they are dealing with, and the ATR is one of the most common. It clears up a lot of questions and can be a way to use mathematics to determine many things. This can keep you from taking unnecessary risks, and focus on market direction more than anything else. In fact, there are a lot of traders that I know and respect that will refer to the risk they are taking as “2 times ATR”, or something similar. I encourage you to experiment with this.

