


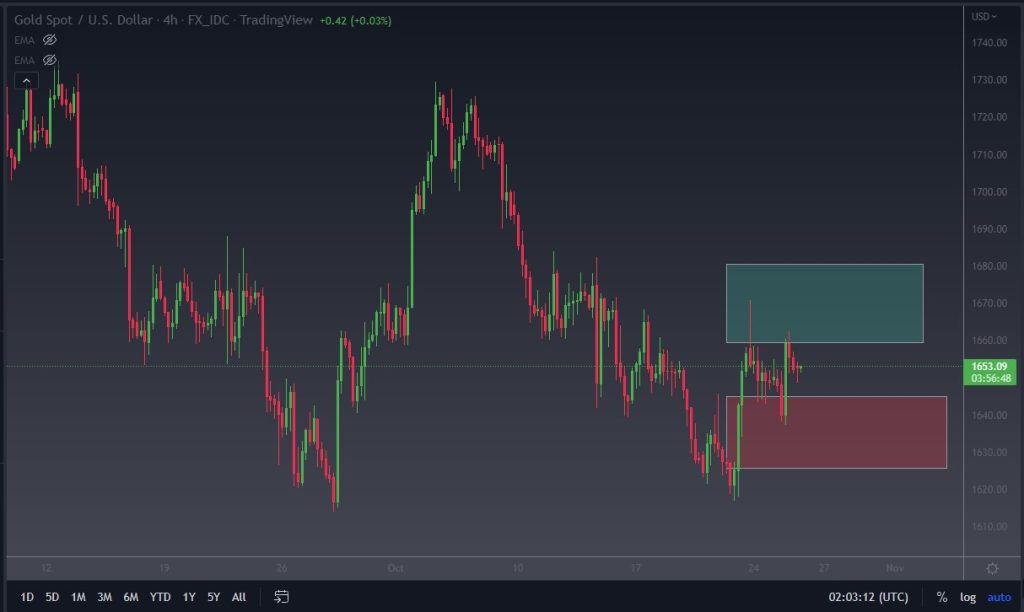
I sometimes lay out my charts like the one you are looking at underneath. This is spot gold, and you will see a green box and a red one. The market breaking into the green box is a buy. If we get above $1660, I am buying and will be looking for a potential move to the $1680 level. However, if we fall and go into the red box, I will be selling gold, at $1650, and aiming for a move down to the $1625 level.
Thank you very much for sharing, I learned a lot from your article. Very cool. Thanks.
Thanks for sharing. I read many of your blog posts, cool, your blog is very good.
Thanks for sharing. I read many of your blog posts, cool, your blog is very good.
Your article helped me a lot, is there any more related content? Thanks!
Your article helped me a lot, is there any more related content? Thanks!
I don’t think the title of your article matches the content lol. Just kidding, mainly because I had some doubts after reading the article.
I don’t think the title of your article matches the content lol. Just kidding, mainly because I had some doubts after reading the article. https://www.binance.info/ph/register?ref=B4EPR6J0
Thanks for sharing. I read many of your blog posts, cool, your blog is very good.
Your point of view caught my eye and was very interesting. Thanks. I have a question for you.
Thank you for your sharing. I am worried that I lack creative ideas. It is your article that makes me full of hope. Thank you. But, I have a question, can you help me?
Your article helped me a lot, is there any more related content? Thanks!
Your article helped me a lot, is there any more related content? Thanks!
I don’t think the title of your article matches the content lol. Just kidding, mainly because I had some doubts after reading the article.
Thank you for your sharing. I am worried that I lack creative ideas. It is your article that makes me full of hope. Thank you. But, I have a question, can you help me? https://www.binance.info/register?ref=IXBIAFVY
Your article helped me a lot, is there any more related content? Thanks!
Thank you for your sharing. I am worried that I lack creative ideas. It is your article that makes me full of hope. Thank you. But, I have a question, can you help me?
Thanks for sharing. I read many of your blog posts, cool, your blog is very good. https://accounts.binance.info/ro/register?ref=HX1JLA6Z
Your point of view caught my eye and was very interesting. Thanks. I have a question for you.
I don’t think the title of your article matches the content lol. Just kidding, mainly because I had some doubts after reading the article.
Your article helped me a lot, is there any more related content? Thanks!
Thank you for your sharing. I am worried that I lack creative ideas. It is your article that makes me full of hope. Thank you. But, I have a question, can you help me? https://www.binance.com/ar-BH/register?ref=S5H7X3LP
I don’t think the title of your article matches the content lol. Just kidding, mainly because I had some doubts after reading the article.
I don’t think the title of your article matches the content lol. Just kidding, mainly because I had some doubts after reading the article. https://accounts.binance.bh/register/person?ref=JW3W4Y3A
I don’t think the title of your article matches the content lol. Just kidding, mainly because I had some doubts after reading the article.
Your article helped me a lot, is there any more related content? Thanks!
Thank you for your sharing. I am worried that I lack creative ideas. It is your article that makes me full of hope. Thank you. But, I have a question, can you help me?
I don’t think the title of your article matches the content lol. Just kidding, mainly because I had some doubts after reading the article.
Your point of view caught my eye and was very interesting. Thanks. I have a question for you. https://www.binance.com/register?ref=QCGZMHR6