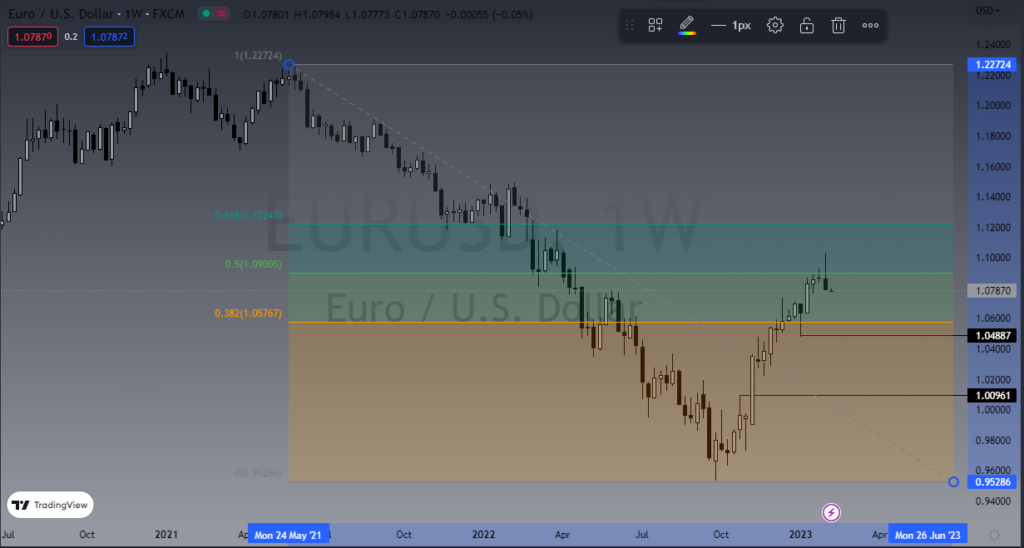
On Sunday, I always make it a point to look at the charts in the FX markets from a longer-term perspective. This means the weekly charts, and even sometimes the monthly timeframe. The markets have been decidedly anti-dollar for a while, but when I scanned this weekend, I noticed that there are several charts that suddenly don’t look as anti-greenback as they once did. This includes, the GBP/USD, EUR/USD, NZD/USD, and AUD/USD pairs.
For the purpose of this blog post, I am focusing on the EUR/USD pair, but honestly, I could use several other ones. This includes even more than the ones I listed above, but the EUR/USD is such a huge portion of the US Dollar Index, that it is crucial to understand where it is going. The chart has shown itself to form a shooting star, and it is right at the 50% Fibonacci retracement level. This was after the Euro was repudiated at the psychologically important 1.10 level. Because of this, I think we are ready for a pullback. 1.06 is a reasonable target, and if we break down below there – we could really start to accelerate to the downside, something that we would see across the board in the FX markets. I will be adding to shorts if this happens.


