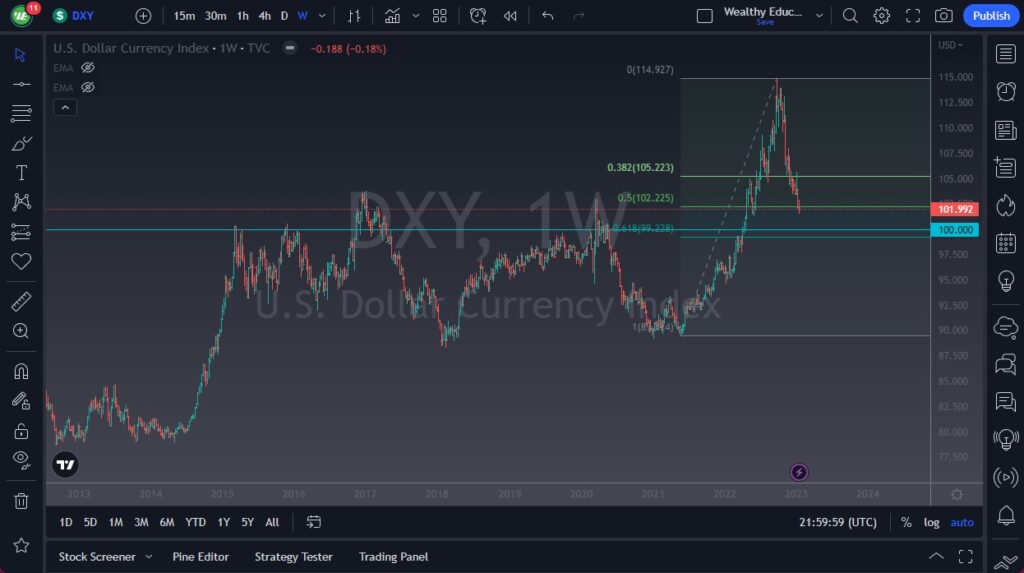
The US Dollar Index, or the DXY, is the first chart I look at when getting ready for the next week. This chart tells us about the strength or weakness of the greenback against a basket of currencies, and can tell us about the overall risk appetite of the markets. The chart can be used to extrapolate the idea of whether or not traders are willing to buy things such as stocks, commodities, and emerging markets instead of the US Dollar or US Treasuries.
At this point, everyone knows that the USD has been struggling. The real question revolves around what the Fed will be doing in the future. A lot of traders are out there expecting that the Fed will start to slow down its tightening and perhaps even pivot back to easing sometime this year. Markets try to get ahead of that curve, as they are often referred to as “forward looking instruments.”
However, I believe that the Federal Reserve will take much longer to pivot than the general consensus is at the moment. The DXY is approaching an area where we could be getting ready to find support as well – the 100 level. Yes, this is a large, round, and psychological number, and a lot of people will be looking in this area. Also, we have the 61.8% Fibonacci retracement in the same neighborhood. (I believe that Fibonacci is total bullshit, but I know it will have some traders jumping in. This being said – it could take a few weeks to get there. I think that this will line up with the Federal Reserve meeting and announcement, due February 1st. I think Powell will have to get aggressive with his language again. Whether or not he fucks it up is a completely different matter, but he will try to remind the markets that he isn’t changing paths anytime soon. Inflation is still over three times the target rate in the USA.


