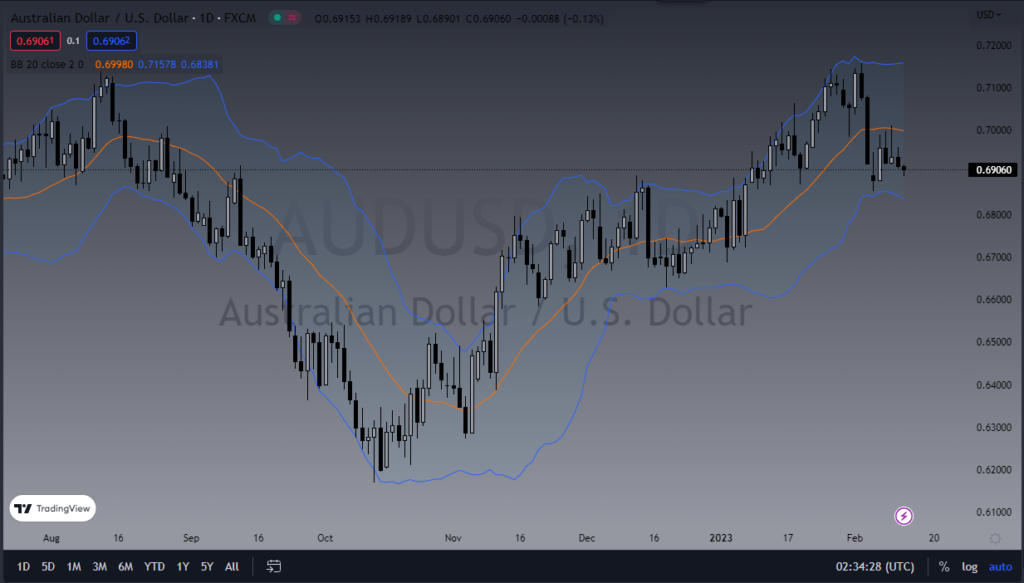
The Bollinger Band indicator is a popular tool used by traders and investors to determine the volatility and potential price direction of a security. Developed by John Bollinger in the 1980s, this indicator has become a staple in technical analysis and is widely used by traders and investors alike. In this essay, we will discuss the Bollinger Band indicator in detail, including its uses, limitations, and various ways in which people use it.
Introduction:
The Bollinger Band indicator is a technical analysis tool that is used to determine the volatility and potential price direction of a security. It is comprised of three lines plotted on a chart: the upper band, the lower band, and a moving average line in the middle. The upper and lower bands are calculated based on the standard deviation of the security’s price, while the moving average line represents the average price of the security over a set period of time.
Uses of the Bollinger Band Indicator:
The Bollinger Band indicator is used for a variety of purposes, including determining volatility, identifying trends, and detecting potential price reversals.
Volatility:
One of the primary uses of the Bollinger Band indicator is to determine the volatility of a security. The upper and lower bands expand and contract based on the price action of the security, providing traders with a measure of the security’s volatility. During periods of high volatility, the bands will expand, and during periods of low volatility, the bands will contract. By monitoring the width of the Bollinger Bands, traders can get a sense of the security’s volatility and make more informed trading decisions.
Trend Identification:
The Bollinger Band indicator can also be used to identify trends. The moving average line in the middle of the Bollinger Bands can provide a measure of the security’s trend direction. If the price of the security is above the moving average line, it is typically considered to be in an uptrend, and if it is below the moving average line, it is considered to be in a downtrend. By monitoring the trend direction, traders can make more informed trading decisions.
Price Reversals:
Another important use of the Bollinger Band indicator is to detect potential price reversals. When the price of a security is trending, it will often touch or penetrate the upper or lower Bollinger Band. If the price then reverses direction, it can be a sign that the trend is about to change. By monitoring these price reversals, traders can identify potential buying or selling opportunities.
Limitations of the Bollinger Band Indicator:
While the Bollinger Band indicator is a useful tool, it is not without its limitations. Some of the limitations of the Bollinger Band indicator include its sensitivity to price action and its potential for false signals.
Sensitivity to Price Action:
One of the limitations of the Bollinger Band indicator is its sensitivity to price action. Because the Bollinger Bands are calculated based on the standard deviation of the security’s price, they can be quite sensitive to the price action of the security. This can lead to false signals, especially during times of high volatility.
False Signals:
Another limitation of the Bollinger Band indicator is its potential for false signals. Because the Bollinger Bands are sensitive to price action, they can sometimes produce false signals that can be misleading. This can be especially problematic during periods of high volatility when the bands are expanding and contracting rapidly.
Conclusion:
In conclusion, the Bollinger Band indicator is a popular and useful tool used by traders and investors to determine the volatility and potential price direction of a security. Despite its limitations, a lot of traders will find use in this tool. The common “reversion to the mean” strategy is widely followed, which can be a great reason to at the very least understand what the indicator is doing when looking at potential trade setups.

