


The use of Fibonacci ratios in trading has been a popular subject among traders for many years. Fibonacci ratios, also known as Fibonacci retracements, are a technical analysis tool that traders use to identify potential levels of support and resistance in the market. The idea is that the market will retrace a predictable portion of a move, after which it will continue to move in the original direction. While many traders believe that Fibonacci ratios can help them make better trading decisions, the truth is that there is little evidence to support this claim. In this essay, we will explore the folly of using Fibonacci ratios to make trading decisions, including statistics on the relation between Fibonacci and trading success, and how humans tend to look for patterns that aren’t there.
Fibonacci ratios are based on the work of the 13th century mathematician Leonardo Fibonacci, who discovered a sequence of numbers that are said to be present in nature. This sequence is known as the Fibonacci sequence, and it is made up of numbers that are the sum of the previous two numbers in the sequence. For example, the first ten numbers in the Fibonacci sequence are 0, 1, 1, 2, 3, 5, 8, 13, 21, and 34.
Traders use Fibonacci ratios to identify potential levels of support and resistance in the market by plotting horizontal lines on a chart at the key Fibonacci levels, such as 23.6%, 38.2%, 50%, 61.8%, and 100%. The idea is that the market will retrace a predictable portion of a move, after which it will continue to move in the original direction. However, the problem with this approach is that there is little evidence to support the idea that the market will retrace a predictable portion of a move.
In fact, numerous studies have shown that Fibonacci ratios are not a reliable indicator of market behavior. For example, a study published in the Journal of Finance in 2002 found that Fibonacci retracements were not a profitable trading strategy, even when combined with other technical indicators. Another study, published in the Journal of Economics and Business in 2003, found that Fibonacci retracements were not a useful tool for predicting stock prices.
One of the main problems with using Fibonacci ratios to make trading decisions is that humans tend to look for patterns that aren’t there. This is known as apophenia, which is the tendency to see patterns or connections in random or meaningless data. The human brain is wired to look for patterns, and when we see something that looks like a pattern, we tend to believe that it is real. However, when it comes to the financial markets, the data is complex, and it is easy to find patterns that are not really there.
Furthermore, it has been found that even if there are patterns in the market, it is impossible to predict it with any accuracy. The market is constantly changing and adapting to new information and influences, which can make even the most promising patterns irrelevant in a matter of minutes or even seconds.
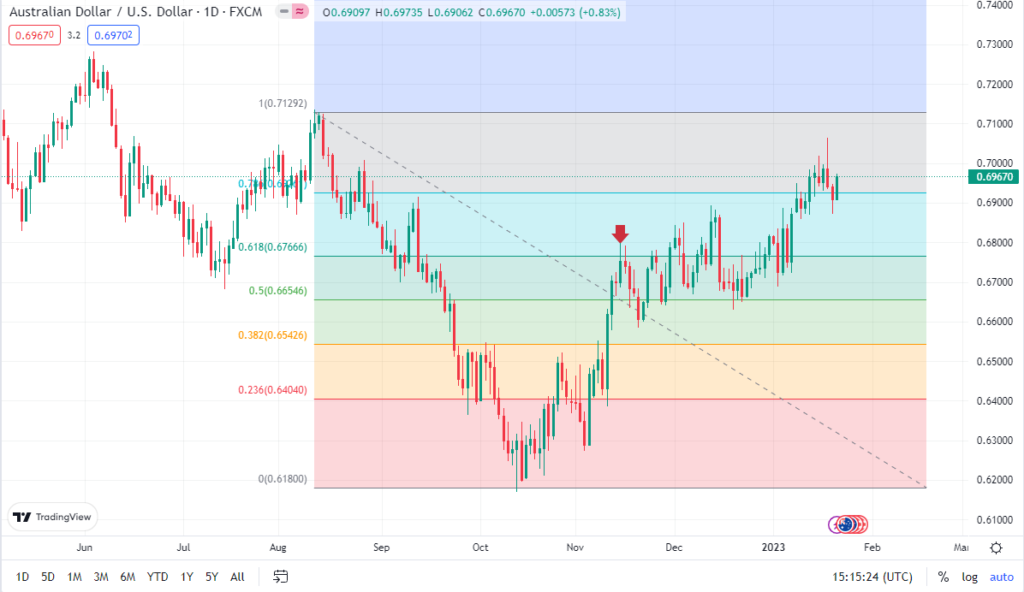
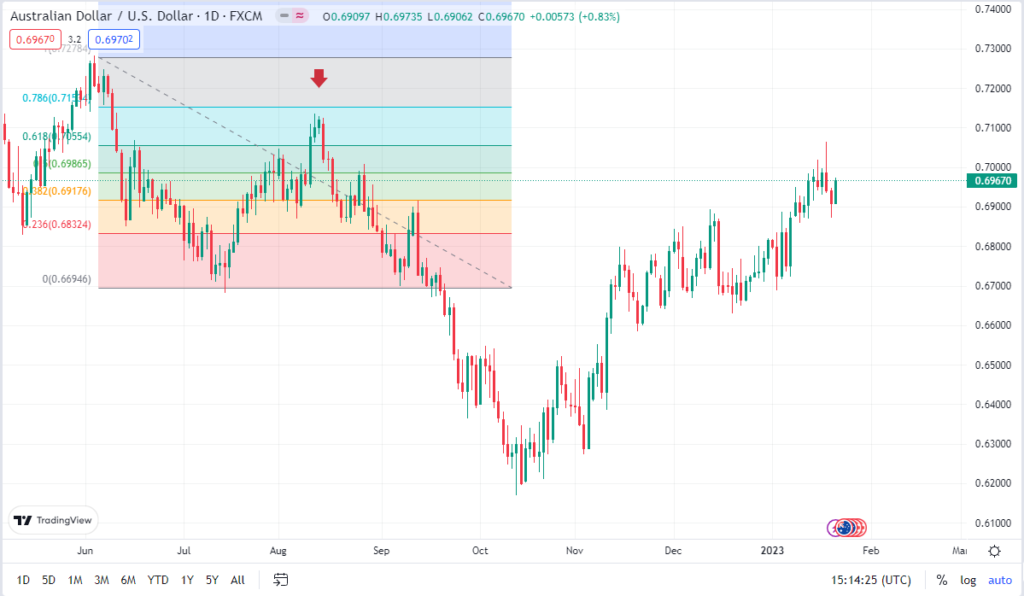
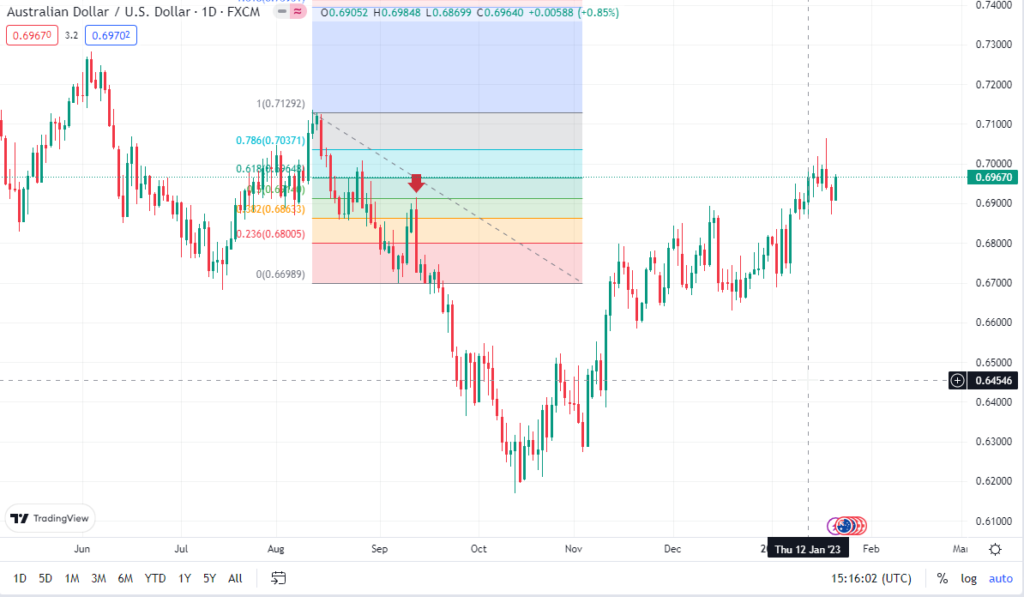
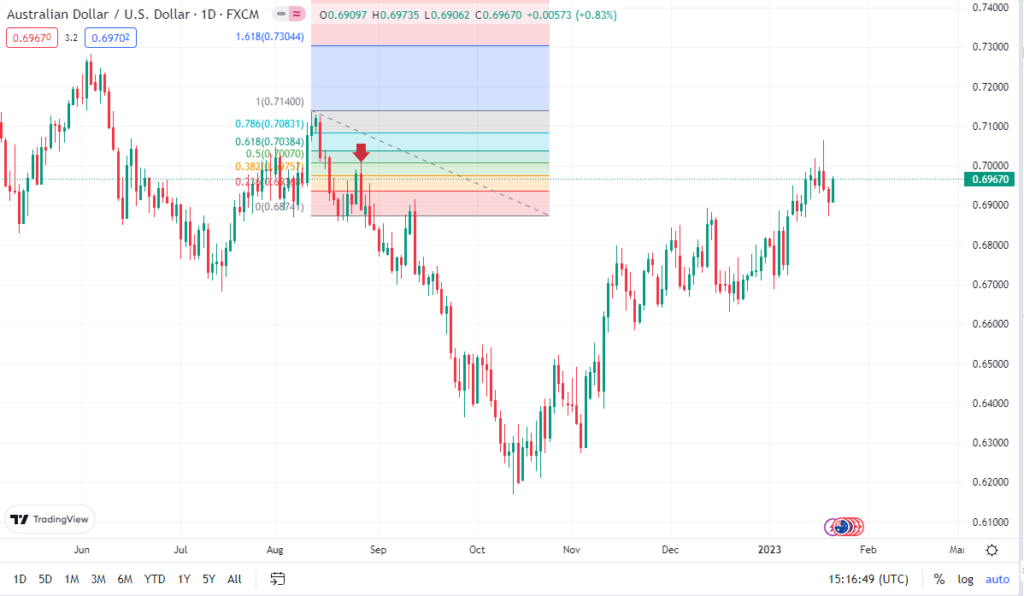
SAME CHArt, different levels. Which one of these magic patterns are correct?
In Conclusion:
In conclusion, the use of Fibonacci ratios in trading is a popular but misguided approach. There is little evidence to support the idea that Fibonacci ratios can help traders make better trading decisions. In fact, numerous studies have shown that Fibonacci ratios are not a reliable indicator of market behavior. Additionally, humans tend to look for patterns that aren’t there, which can lead to false conclusions and poor trading decisions.
In order to make better trading decisions, traders should focus on using a combination of fundamental and technical analysis, and should be aware of the limitations of
Thank you very much for sharing, I learned a lot from your article. Very cool. Thanks.
Your article helped me a lot, is there any more related content? Thanks!
Can you be more specific about the content of your article? After reading it, I still have some doubts. Hope you can help me.
Your point of view caught my eye and was very interesting. Thanks. I have a question for you.
Your point of view caught my eye and was very interesting. Thanks. I have a question for you.
Can you be more specific about the content of your article? After reading it, I still have some doubts. Hope you can help me. https://www.binance.info/pt-PT/register?ref=DB40ITMB
Thanks for sharing. I read many of your blog posts, cool, your blog is very good.
Thanks for sharing. I read many of your blog posts, cool, your blog is very good.
Can you be more specific about the content of your article? After reading it, I still have some doubts. Hope you can help me.
Can you be more specific about the content of your article? After reading it, I still have some doubts. Hope you can help me.
Thank you for your sharing. I am worried that I lack creative ideas. It is your article that makes me full of hope. Thank you. But, I have a question, can you help me?
I don’t think the title of your article matches the content lol. Just kidding, mainly because I had some doubts after reading the article. https://accounts.binance.info/de-CH/register-person?ref=W0BCQMF1
Your article helped me a lot, is there any more related content? Thanks! https://accounts.binance.com/ar/register-person?ref=PORL8W0Z
Your point of view caught my eye and was very interesting. Thanks. I have a question for you. https://www.binance.info/register?ref=IXBIAFVY
Your point of view caught my eye and was very interesting. Thanks. I have a question for you. https://www.binance.com/join?ref=IXBIAFVY
Your article helped me a lot, is there any more related content? Thanks!
Can you be more specific about the content of your article? After reading it, I still have some doubts. Hope you can help me.
Thank you for your sharing. I am worried that I lack creative ideas. It is your article that makes me full of hope. Thank you. But, I have a question, can you help me?
Your article helped me a lot, is there any more related content? Thanks!
I don’t think the title of your article matches the content lol. Just kidding, mainly because I had some doubts after reading the article.
Your article helped me a lot, is there any more related content? Thanks! https://accounts.binance.bh/register/person?ref=IHJUI7TF
Can you be more specific about the content of your article? After reading it, I still have some doubts. Hope you can help me.
I don’t think the title of your article matches the content lol. Just kidding, mainly because I had some doubts after reading the article.
Your article helped me a lot, is there any more related content? Thanks! https://www.binance.info/register?ref=QCGZMHR6
Thanks for sharing. I read many of your blog posts, cool, your blog is very good.
Your article helped me a lot, is there any more related content? Thanks!
Your article helped me a lot, is there any more related content? Thanks! https://www.binance.bh/register?ref=QCGZMHR6
References:
Lollybet Casino Mindesteinzahlung https://69.cholteth.com/
References:
Lollybet Casino Mobile http://www.google.com.sl
Your point of view caught my eye and was very interesting. Thanks. I have a question for you.