


Gold markets experienced a brief pullback followed by a rebound as value hunters entered the marketplace. Technical indicators such as the 200-Day Exponential Moving Average and the 61% Fibonacci level played a crucial role in attracting traders. However, the relationship with the US Dollar and interest rates remains uncertain, impacting the market’s direction.
The gold market witnessed a minor pullback during Monday’s trading session, but quickly rebounded, fueled by the entry of value hunters. Traders found solace in the technical support provided by the 200-Day Exponential Moving Average (EMA) and the 61% Fibonacci level. These levels acted as crucial factors in attracting buyers back into the market, indicating that gold bulls might still have a chance.
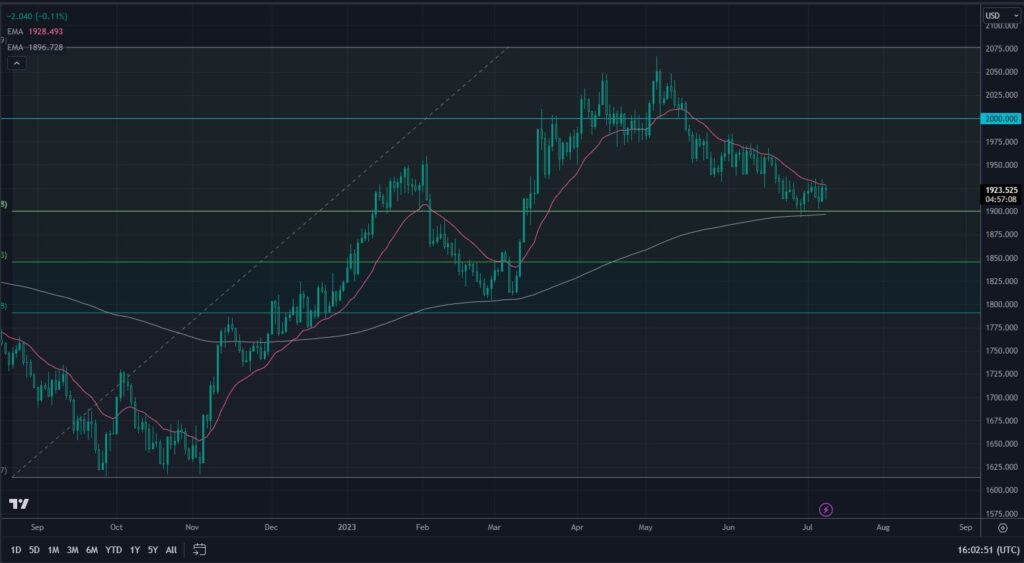
At present, the gold market finds itself trading within a range defined by the 200-Day EMA below and the 50-Day EMA above. Such a range often indicates an impending squeeze, which could potentially lead to significant price movements in either direction. Moreover, the recent holding of the 61.8% Fibonacci level offers hope for gold bulls, suggesting that the market might have found some stability.
However, it is important to closely monitor the US Dollar and the Forex market, as they exhibit a negative correlation with gold. Fluctuations in these markets can influence the direction of gold prices. Furthermore, the potential impact of dropping interest rates on gold should be carefully considered, as it was hinted at during Monday’s trading session. Any news regarding interest rate adjustments can significantly affect the sentiment and investment decisions of traders in the gold market.
To gauge the future direction of gold prices, market participants eagerly await a breakout above the $1950 level. Such a move would present a genuine opportunity for an upward trend, with the next target potentially being the psychologically significant $2000 level. On the other hand, if the market breaks down below the 200-Day EMA, which aligns with the $1900 level, additional selling pressure could emerge, potentially erasing the previous gains and pushing prices toward the $1800 level.
In the global market, investors and traders are closely monitoring the actions of central banks, as there is an underlying sense of uncertainty regarding the next steps in terms of interest rate hikes. Any indication of a loosening of monetary policies worldwide could serve as a catalyst for a significant upward movement in gold prices.
As gold markets find support amidst volatility and uncertainty, the focus remains on establishing a potential bottom. Technical factors such as the 200-Day EMA and the 61% Fibonacci level have attracted traders, but the market’s direction is still influenced by the US Dollar, interest rates, and central bank actions. Clarity regarding these factors will determine the future trajectory of gold prices.