

MACD (Moving Average Convergence Divergence) is a technical indicator that is often used by currency traders to identify trends and potential buy or sell signals in the market. The indicator consists of two lines, the MACD line and the signal line, which are calculated using the difference between a short-term and a long-term moving average. There is also the histogram, which shows how far apart the two moving averages are. Most FX traders will pay just as much, if not more attention to it then just the lines themselves.
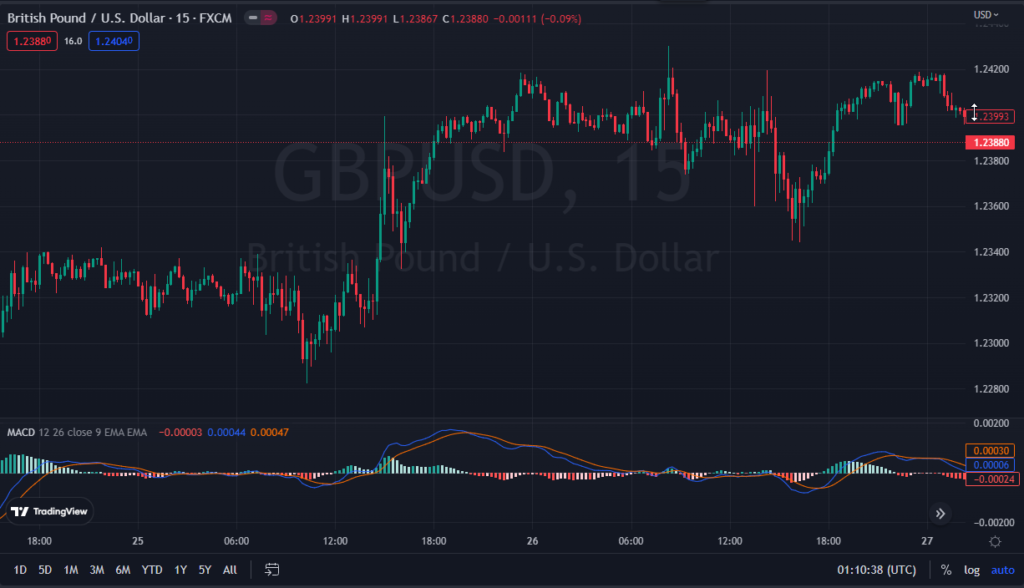
Traders typically use the MACD to identify bullish or bearish market conditions and potential trend changes. A bullish signal is generated when the MACD moving average lines cross above the signal line (also thought of as “zero”), indicating that the short-term moving average has crossed above the long-term moving average. A bearish signal is generated when the MACD line crosses below the signal line, indicating that the short-term moving average has crossed below the long-term moving average.
Traders may also look for divergences between the MACD line and the currency price action, which can indicate potential trend changes. A bullish divergence occurs when the MACD line is making new highs while the currency price is making new lows. A bearish divergence occurs when the MACD lines are making new lows while the currency price is making new highs.
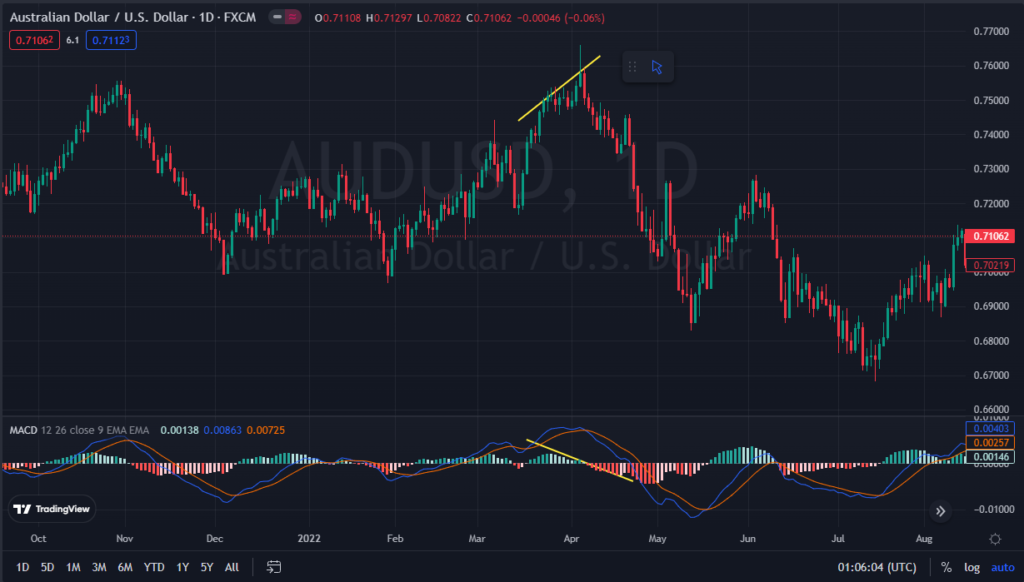
It’s important to note that the MACD is a lagging indicator, meaning it will only provide a signal after a trend has already begun. Thus, it’s important to use other technical analysis tools in conjunction with the MACD to confirm or deny the strength of a trade signal. For myself, I always look for price action to confirm what MACD might be hinting at. It is best to think of oscillators like the MACD as secondary indications of market conditions.
Thank you very much for sharing, I learned a lot from your article. Very cool. Thanks.
Your article helped me a lot, is there any more related content? Thanks!
Can you be more specific about the content of your article? After reading it, I still have some doubts. Hope you can help me.
Thanks for sharing. I read many of your blog posts, cool, your blog is very good.
Thanks for sharing. I read many of your blog posts, cool, your blog is very good.
Thanks for sharing. I read many of your blog posts, cool, your blog is very good. https://www.binance.info/zh-TC/register?ref=VDVEQ78S
Your article helped me a lot, is there any more related content? Thanks!
Your point of view caught my eye and was very interesting. Thanks. I have a question for you.
I don’t think the title of your article matches the content lol. Just kidding, mainly because I had some doubts after reading the article.
Can you be more specific about the content of your article? After reading it, I still have some doubts. Hope you can help me. https://www.binance.info/sl/register?ref=IJFGOAID
I don’t think the title of your article matches the content lol. Just kidding, mainly because I had some doubts after reading the article.
Your article helped me a lot, is there any more related content? Thanks! https://www.gate.com/share/XwNAUwgM
Thank you for your sharing. I am worried that I lack creative ideas. It is your article that makes me full of hope. Thank you. But, I have a question, can you help me? https://www.binance.com/si-LK/register?ref=LBF8F65G
Your article helped me a lot, is there any more related content? Thanks! https://www.binance.com/id/register?ref=UM6SMJM3
I don’t think the title of your article matches the content lol. Just kidding, mainly because I had some doubts after reading the article.
I don’t think the title of your article matches the content lol. Just kidding, mainly because I had some doubts after reading the article.
Thank you for your sharing. I am worried that I lack creative ideas. It is your article that makes me full of hope. Thank you. But, I have a question, can you help me?
Thanks for sharing. I read many of your blog posts, cool, your blog is very good. https://accounts.binance.com/es-MX/register?ref=GJY4VW8W
Can you be more specific about the content of your article? After reading it, I still have some doubts. Hope you can help me.
Your point of view caught my eye and was very interesting. Thanks. I have a question for you.
Your article helped me a lot, is there any more related content? Thanks! https://accounts.binance.info/register-person?ref=IXBIAFVY
Can you be more specific about the content of your article? After reading it, I still have some doubts. Hope you can help me. https://accounts.binance.info/de-CH/register/person?ref=W0BCQMF1
Thank you for your sharing. I am worried that I lack creative ideas. It is your article that makes me full of hope. Thank you. But, I have a question, can you help me? https://accounts.binance.com/fr/register?ref=T7KCZASX
Your point of view caught my eye and was very interesting. Thanks. I have a question for you. https://accounts.binance.bh/register/person?ref=JW3W4Y3A
Thank you for your sharing. I am worried that I lack creative ideas. It is your article that makes me full of hope. Thank you. But, I have a question, can you help me? https://www.binance.bh/register?ref=JW3W4Y3A
Your point of view caught my eye and was very interesting. Thanks. I have a question for you.
Your point of view caught my eye and was very interesting. Thanks. I have a question for you.